Percentile
Percentile
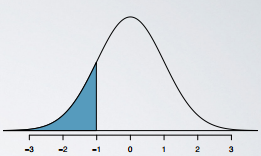
When the distribution is normal, Z scores can also be used to calculate Percentiles. Percentile is the percentage of observations that fall below a given data point.
Graphically,percentileis the area below the probability distribution curve to the left of that observation.
For example, in R, the function pnorm() gives the percentile of an observation, given the mean and the standard deviation of the distribution.
> pnorm(-1, mean = 0, sd = 1)
[1] 0.1586553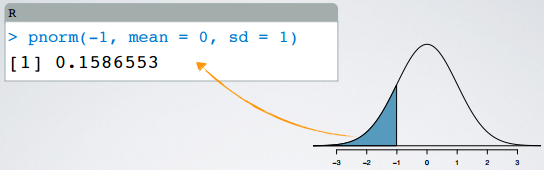
You can also obtain the same probability using a web applet.
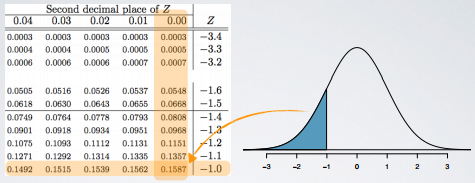
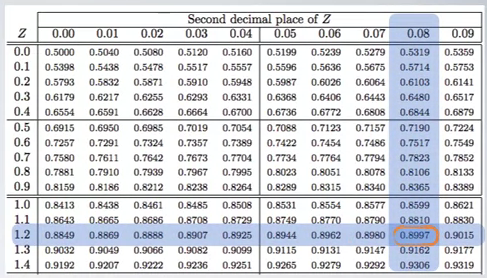
We can also avoid the computation all together and use a Normal Probability Table.
Example 1
SAT scores are distributed normally with mean = 1500 and SD = 300. Pam earned an 1800 on her SAT. What is Pam's percentile score?
Solution 1 - use R pnorm()
> pnorm(1800, mean = 1500, sd = 300)
[1] 0.8413
This means that Pam scored better than 84.13% of the SAT takers.
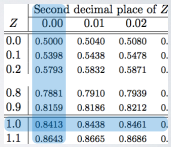
Solution 2 - use Normal Probability Table
First, we calculate the Z score:
    1800 - 1500
Z = ------------ = 1
       300
Then, in the table, we look for the Z score of 1.
Example 2
SAT scores are distributed normally with mean = 1500 and SD = 300. A friend of yours tells you that she scored in the top 10% on the SAT. What is the lowest possible score she could have gotten?
We are looking for the cut off value for the top 10% of the distribution. This is a different problem than the Example 1. This time we don't know the value of the observation, but we do know or at least we can get its percentile score.
Since the total area under the curve is 1, the percentile score associated with the cut off value for the top 10% is:
# Work out the percentile score
1 - 0.10 = 0.90
Solution 1: use Z score
The Z score is calculated by:
     observation - mean
Z = ---------------------
             SD
We know the Z, SD, and mean, so the observation can be calculated:
observation = Z * SD + mean
And the Z score can be looked up from Normal Probability Table. Find the closest value, it is 0.8997 in this example.
So, it is:
observation = Z * SD + mean = (1.28 × 300) + 1500 = 1844
Solution 2: use R qnorm()
> qnorm(0.90, mean = 1500, sd = 300)
[1] 1884.465
References & Resources
- N/A
Latest Post
- Dependency injection
- Directives and Pipes
- Data binding
- HTTP Get vs. Post
- Node.js is everywhere
- MongoDB root user
- Combine JavaScript and CSS
- Inline Small JavaScript and CSS
- Minify JavaScript and CSS
- Defer Parsing of JavaScript
- Prefer Async Script Loading
- Components, Bootstrap and DOM
- What is HEAD in git?
- Show the changes in Git.
- What is AngularJS 2?
- Confidence Interval for a Population Mean
- Accuracy vs. Precision
- Sampling Distribution
- Working with the Normal Distribution
- Standardized score - Z score
- Percentile
- Evaluating the Normal Distribution
- What is Nodejs? Advantages and disadvantage?
- How do I debug Nodejs applications?
- Sync directory search using fs.readdirSync