Sampling Distribution
Introduction
In this lession, the sampling distribution will be introduced.
Definition of Sampling Distributions
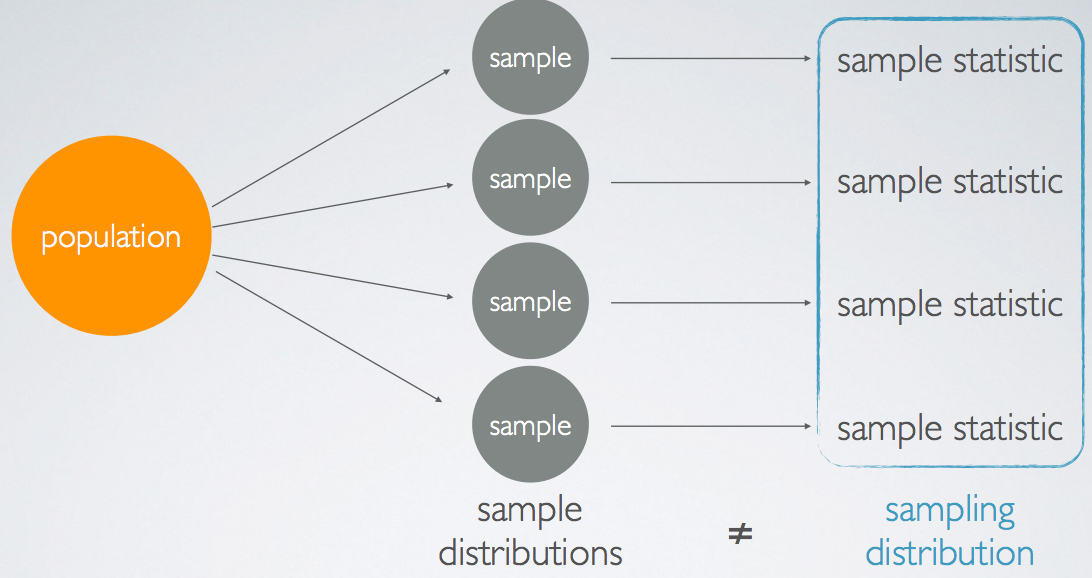
Suppose we have a population of interest and we have done the following works:
- Step 1: We take a random sample from it.
- Step 2: Based on that sample, we calculate a sample statistic, e.g. the mean of that sample.
- Step 3: Then, we take another random sample and also calculate and record its mean.
- ......
- Step n: Then, we do the step 1 and 2 again and again, many more times.

Each one of the samples will have their own distribution, which we call sample distributions. Each observation in these distributions is a randomly sampled unit from the population. The values we recorded from example, the sample statistic (In this case, a sample mean), also make a new distribution, where each observation is not a unit from the population, but a sample statistic.
The distribution of these sample statistic is called the sampling distribution.
Note: the two terms, sample distributions and sampling distribution are different concepts.
Example of Sampling Distribution
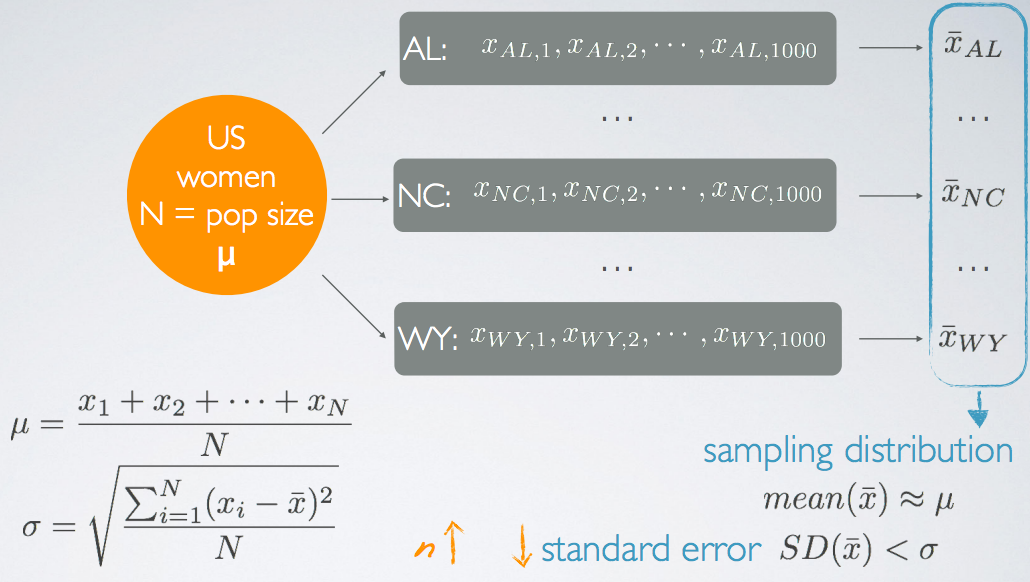
Suppose we are interested in the average height of the US women.
- Our population of interest is US women, denoted by N.
- The average height of the US women is denoted by μ.
Then suppose we take random samples of 1000 women from each state, represented by AL, NC ... WY. For each state, we calculate the state mean, denoted by x̄ (x bar). So, there is a dataset consisting of a bunch of state means. We call this distribution the sampling distribution.

- The mean of the sample means (In this case, the state mean) will probably be around the true population, mean(x̄) ≈ μ ;
- The standard deviation (SD) of the sample means will probably be much lower than the population SD, SD(x̄) < σ. This is because we would expect the average height for each state to be pretty close to one another. We call the SD of the sample means the standard error.
- In fact, as the sample size n increases, the standard error will decrease. The fewer women we sample from each state, the more variable we would expect the sample means to be.
References & Resources
- N/A
Latest Post
- Dependency injection
- Directives and Pipes
- Data binding
- HTTP Get vs. Post
- Node.js is everywhere
- MongoDB root user
- Combine JavaScript and CSS
- Inline Small JavaScript and CSS
- Minify JavaScript and CSS
- Defer Parsing of JavaScript
- Prefer Async Script Loading
- Components, Bootstrap and DOM
- What is HEAD in git?
- Show the changes in Git.
- What is AngularJS 2?
- Confidence Interval for a Population Mean
- Accuracy vs. Precision
- Sampling Distribution
- Working with the Normal Distribution
- Standardized score - Z score
- Percentile
- Evaluating the Normal Distribution
- What is Nodejs? Advantages and disadvantage?
- How do I debug Nodejs applications?
- Sync directory search using fs.readdirSync