Accuracy vs. Precision
Introduction
This section is going to talk about accuracy and precision of confidence intervals.
The accuracy is defined in terms of whether or not the confidence interval contains the true population parameter.
The precision refers to the width of a confidence interval.
Confidence Level
First, let's define the confidence level.
- Suppose we took many samples and built a confidence interval from each sample using the equation:
point estimate ± 1.96 × SE
- Then about 95% of those intervals would contain the true population mean ( μ ).
- Commonly used confidence levels in practice are 90%, 95%, 98%, and 99%.
Remember that we saw earlier that changing the confidence level simply means adjusting the value of the critical value in the confidence interval formula.
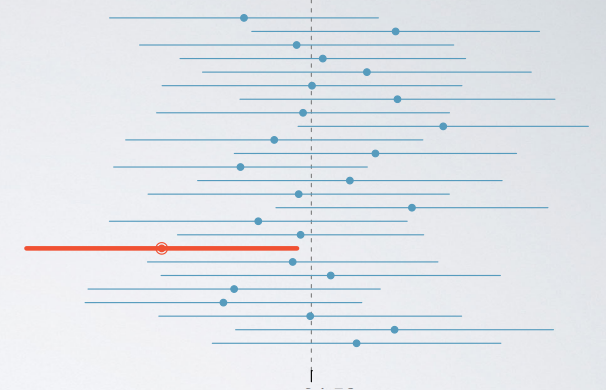
For example, the vertical line represents the true population mean which we rarely known. And each horizontal line is an interval calculated based on different random sample. There are 25 total interval plotted, and 24 of them contain the true population mean, and one does not. Therefore, the confidence level for these intervals would be 24 over 25:
24 / 25 = 0.96 = 96%
This is not exactly 95%, but it is close enough. If we examine many more intervals, the percentage of those capturing the true population parameter will be closer to 95%.
Wider or narrow interval?
If we want to be very certain that we capture the true population parameter, shall we use a wider interval or a narrower interval? Looking at this figure, it seems like a wider interval would indeed be much better. You can think about the red interval that is plotted on this figure and imagine that it extends even further. It would be much likely for it to then capture the true population parameter which is shown here as the vertical dashed line.
Therefore, as the confidence level increase, so does the width of the confidence interval.
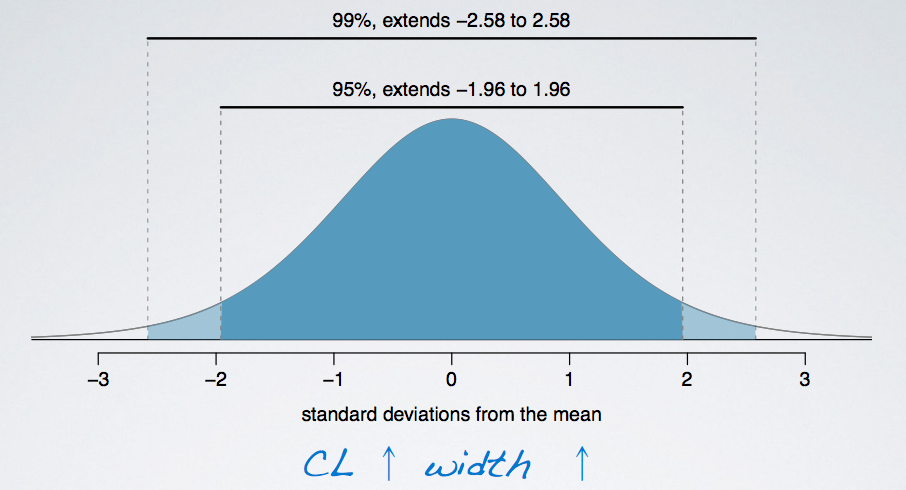
Another way of thinking about this is the width of the area that captures the middle 95% or 99% of the distribution.
- The middle 99% will inevitably span a larger area, and hence the 99% confidence interval is going to be wider. Therefore, as we increase the confidence level, the width of the interval increases as well.
- More accurate means a higher confidence level. So if we are saying that we want to increase accuracy, we also need to increase the confidence level, but this might come at a cost.
What is the drawback when using a wider interval
As the confidence level increase, the width of the confidence interval increase as well. Which then increase the accuracy . However, the precision goes down.
                    CL
                    ↑
                    Width
                    ↑
                    Accuracy
                    ↑, but
                    Precision
                    ↓
Example:
Suppose you are watching the weather forecase, and you are told that the next day, low is -20F and high is 110F.
- Is this accurate? Most likely, yes.
- Tomorrow's temperature is probably going to be somewhere between -20F and 100F, however is it informative? Or, in other wards, is it precise? Not really. It is nearly impossible to figure out what to wear tomorrow according to this information.
Example
The General Social Survey (GSS) is a sociological survey used to collect data on demographic characteristics and attitudes of residents of the US. In 2010, the survey collected responses from 1,154 US residents. Based on the survey results, a 95% confidence interval for the average number of hours Americans have to relax or pursue activities that they enjoy after an average work day was found to be 3.53 to 3.83 hours. Determine if each of the following statements are true or false.
- (a) 95% of Americans spend 3.53 to 3.83 hours relaxing after a work day.
- (b) 95% of random samples of 1,154 Americans will yield confidence intervals that contain the true average number of hours Americans spend relaxing after a work day.
- (c) 95% of the time the true average number of hours Americans spend relaxing after a work day is between 3.53 and 3.83 hours.
- (d) We are 95% confident that Americans in this sample spend on average 3.53 to 3.83 hours relaxing after a work day.
- (a) is False , because the confidence interval is not about individuals in the population. But in stead, about the true population parameter.
- (b) is True , because it is the definition of the confidence level. The percentage of random samples that will yield confidence intervals that contain the true population parameter.
- (c) is False , because the population parameter is not this moving target that is sometimes within an interval and sometime outside of it.
- (d) is False , because the confidence interval is not about the sample mean but instead about the population mean.
References & Resources
- N/A
Latest Post
- Dependency injection
- Directives and Pipes
- Data binding
- HTTP Get vs. Post
- Node.js is everywhere
- MongoDB root user
- Combine JavaScript and CSS
- Inline Small JavaScript and CSS
- Minify JavaScript and CSS
- Defer Parsing of JavaScript
- Prefer Async Script Loading
- Components, Bootstrap and DOM
- What is HEAD in git?
- Show the changes in Git.
- What is AngularJS 2?
- Confidence Interval for a Population Mean
- Accuracy vs. Precision
- Sampling Distribution
- Working with the Normal Distribution
- Standardized score - Z score
- Percentile
- Evaluating the Normal Distribution
- What is Nodejs? Advantages and disadvantage?
- How do I debug Nodejs applications?
- Sync directory search using fs.readdirSync