How do I debug Nodejs applications?
Introduction
Node.js is a JavaScript runtime built on Chrome's V8 JavaScript engine. It is one of the most popular platform for building web server applications. Therefore, we need to get a better understanding of the debug options available for Node.js applications.
Option 1: The Built-in Debugger
The command line debugger is available for the Node.js. You can check here for more documentation.
To use the built-in debugger, start Node.js with the debug argument followed by the path to the script to debug;
node debug [your app]A prompt will be displayed indicating successful launch of the debugger.
An Example using debuggerfor(var i=0; i<5; i++){
debugger;
console.log(i);
}
console.log("done");If we run this app via node debug app.js, it will break when the code hits the debugger line shown below:
$ node debug app.js
< debugger listening on port 5858
connecting... ok
break in /home/robin/app.js:3
  1
  2 for(var i=0; i<5; i++){
  > 3 debugger;
  4 console.log(i); 5 }
debug>
From here, you can use the following debug commands (found in the Node docs) to step through your code:
| Commands | Meaning |
|---|---|
cont, c |
Continue execution |
next, n |
Step next |
step, s |
Step in |
out, o |
Step out |
pause |
Pause running code |
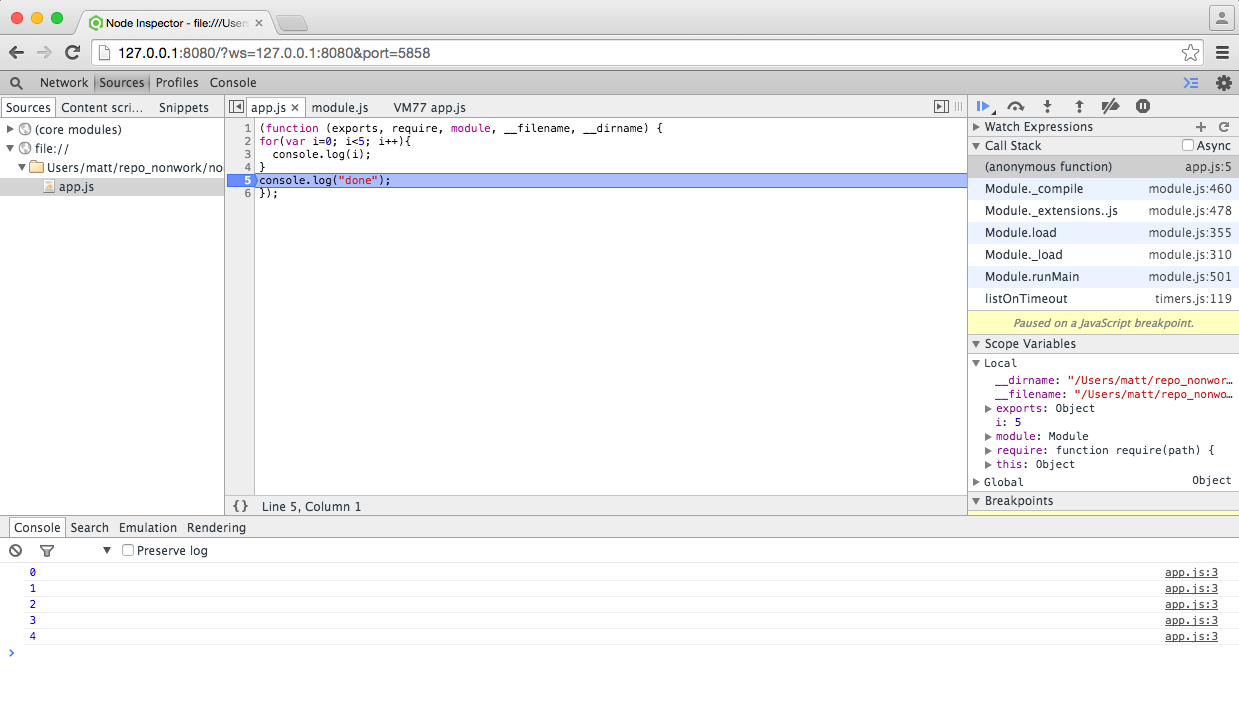
Option 2: Node Inspector
Node-Inspector could save the day! Use it from any browser supporting WebSocket. Breakpoints, profiler, livecoding, etc... It is really awesome.
Install it with:
npm install -g node-inspectorOnce installed, use it to run your Node app by typing:
node-debug app.jsAnd you should see output that looks something like this:
Node Inspector is now available from http://127.0.0.1:8080/?ws=127.0.0.1:8080&port=5858
Debugging `app.js`
Debugger listening on port 5858
It may open up Chrome (assuming Chrome is your default browser) and immediately bring up your app. If it doesn’t do that, simply navigate to the address from the console output (http://127.0.0.1:8080/?ws=127.0.0.1:8080&port=5858 in above example). You can browse your source code and set breakpoints just as you would when debugging client-side JavaScript.
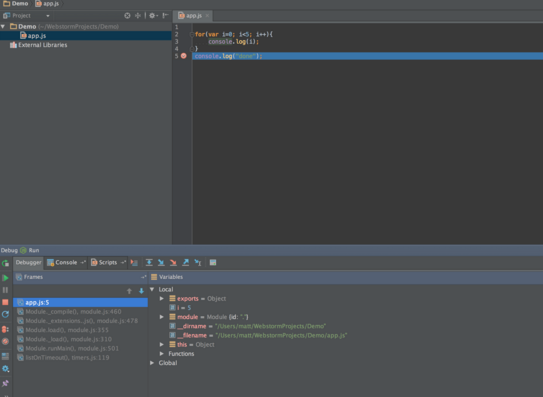
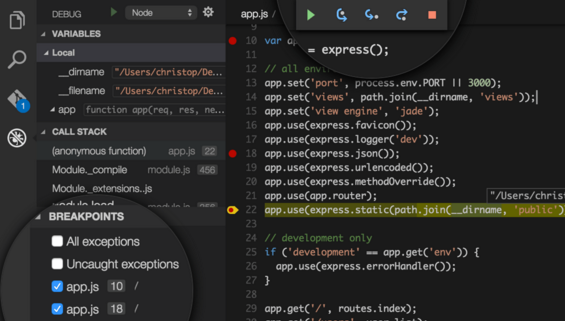
Option 3 - IDE Debuggers
Another way to get access to a nice Node debug environment is to use an IDE, such as Web Storm and Visual Studio Code.
References & Resources
- http://stackoverflow.com/
- http://spin.atomicobject.com/2015/09/25/debug-node-js/
Latest Post
- Dependency injection
- Directives and Pipes
- Data binding
- HTTP Get vs. Post
- Node.js is everywhere
- MongoDB root user
- Combine JavaScript and CSS
- Inline Small JavaScript and CSS
- Minify JavaScript and CSS
- Defer Parsing of JavaScript
- Prefer Async Script Loading
- Components, Bootstrap and DOM
- What is HEAD in git?
- Show the changes in Git.
- What is AngularJS 2?
- Confidence Interval for a Population Mean
- Accuracy vs. Precision
- Sampling Distribution
- Working with the Normal Distribution
- Standardized score - Z score
- Percentile
- Evaluating the Normal Distribution
- What is Nodejs? Advantages and disadvantage?
- How do I debug Nodejs applications?
- Sync directory search using fs.readdirSync