Hierarchical clustering algorithm Numerical Example
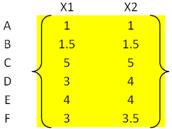
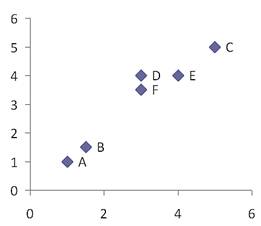
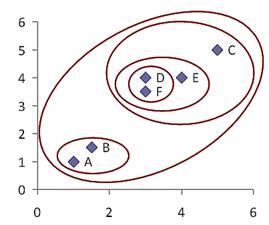
To illustrate hierarchical clustering algorithm, let us use the following simple example. Suppose we have 6 objects (with name A, B, C, D, E and F) and each object have two measured feature X1 and X2. We can plot the features in a scattered plot to get the visualisation of proximity between objects.
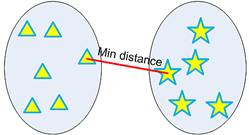
Minimum distance clustering is also called as single linkage hierarchical clustering or nearest neighbor clustering. Distance between two clusters is defined by the minimum distance between objects of the two clusters, as shown below:
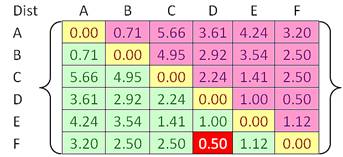
For example, we have given an input distance matrix of size 6 by 6. This distance matrix was calculated based on the object features as explained in the previous section.
We have 6 objects and we put each object into one cluster. Thus, in the beginning we have 6 clusters. Our goal is to group those 6 clusters such that at the end of the iterations, we will have only single cluster consists of the whole six original objects.
In each step of the iteration, we find the closest pair clusters. In this case, the closest cluster is between cluster F and D with shortest distance of 0.5. Thus, we group cluster D and F into cluster (D, F). Then we update the distance matrix (see distance matrix below). Distance between ungrouped clusters will not change from the original distance matrix. Now the problem is how to calculate distance between newly grouped clusters (D, F) and other clusters?
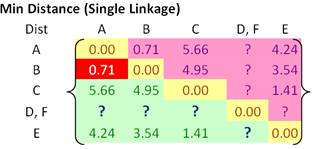
That is exactly where the linkage rule comes into effect. Using single linkage, we specify minimum distance between original objects of the two clusters.
Using the input distance matrix, distance between cluster (D, F) and cluster A is computed as

Distance between cluster (D, F) and cluster B is

Similarly, distance between cluster (D, F) and cluster C is

Finally, distance between cluster E and cluster (D, F) is calculated as

Then, the updated distance matrix becomes
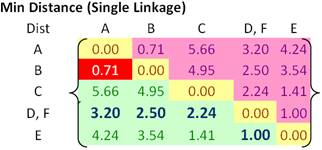
Looking at the lower triangular updated distance matrix, we found out that the closest distance between cluster B and cluster A is now 0.71. Thus, we group cluster A and cluster B into a single cluster name (A, B).
Now we update the distance matrix. Aside from the first row and first column, all the other elements of the new distance matrix are not changed.
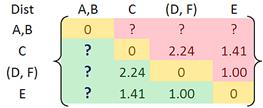
Using the input distance matrix (size 6 by 6), distance between cluster C and cluster (D, F) is computed as

Distance between cluster (D, F) and cluster (A, B) is the minimum distance between all objects involves in the two clusters

Similarly, distance between cluster E and (A, B) is

Then the updated distance matrix is
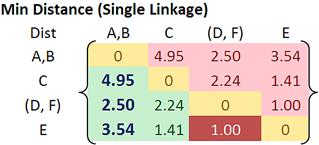
Observing the lower triangular of the updated distance matrix, we can see that the closest distance between clusters happens between cluster E and (D, F) at distance 1.00. Thus, we cluster them together into cluster ((D, F), E ).
The updated distance matrix is given below.
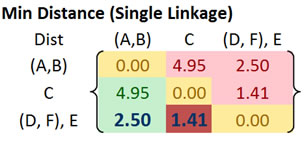
Distance between cluster ((D, F), E) and cluster (A, B) is calculated as

Distance between cluster ((D, F), E) and cluster C yields the minimum distance of 1.41. This distance is computed as

After that, we merge cluster ((D, F), E) and cluster C into a new cluster name (((D, F), E), C).
The updated distance matrix is shown in the figure below
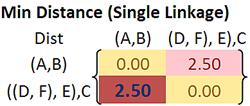
The minimum distance of 2.5 is the result of the following computation


Now if we merge the remaining two clusters, we will get only single cluster contain the whole 6 objects. Thus, our computation is finished. We summarized the results of computation as follow:
- In the beginning we have 6 clusters: A, B, C, D, E and F
- We merge cluster D and F into cluster (D, F) at distance 0.50
- We merge cluster A and cluster B into (A, B) at distance 0.71
- We merge cluster E and (D, F) into ((D, F), E) at distance 1.00
- We merge cluster ((D, F), E) and C into (((D, F), E), C) at distance 1.41
- We merge cluster (((D, F), E), C) and (A, B) into ((((D, F), E), C), (A, B)) at distance 2.50
- The last cluster contain all the objects, thus conclude the computation
Using this information, we can now draw the final results of a dendogram. The dendogram is drawn based on the distances to merge the clusters above.
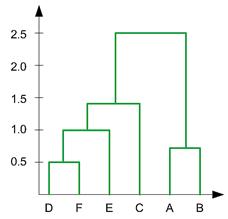
The hierarchy is given as (((D, F), E),C), (A,B). We can also plot the clustering hierarchy into XY space
References & Resources
- http://people.revoledu.com/kardi/tutorial/Clustering/Numerical%20Example.htm
Latest Post
- Dependency injection
- Directives and Pipes
- Data binding
- HTTP Get vs. Post
- Node.js is everywhere
- MongoDB root user
- Combine JavaScript and CSS
- Inline Small JavaScript and CSS
- Minify JavaScript and CSS
- Defer Parsing of JavaScript
- Prefer Async Script Loading
- Components, Bootstrap and DOM
- What is HEAD in git?
- Show the changes in Git.
- What is AngularJS 2?
- Confidence Interval for a Population Mean
- Accuracy vs. Precision
- Sampling Distribution
- Working with the Normal Distribution
- Standardized score - Z score
- Percentile
- Evaluating the Normal Distribution
- What is Nodejs? Advantages and disadvantage?
- How do I debug Nodejs applications?
- Sync directory search using fs.readdirSync