Binomial Distribution
Introduction
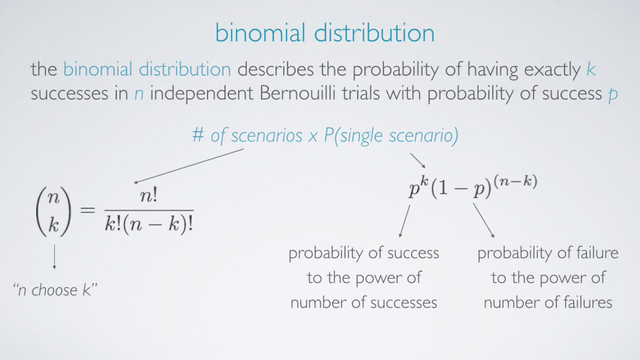
The Binomial Distribution describes the probability of having exactly k successes in n independent Yes/No (success/failure) experiment with probability of success p. The Yes/No (success/failure) experiment is also called a Bernoulli experiment or Bernoulli trial.
Binomial probability can be calculated as
Binomial probability = number of scenarios × P(single scenario)
The probability of single scenario, P(single scenario), is simply
P(single scenario) = pk(1 - p)(n - k)

pk means the probability of success to the power of number of successes.
(1 - p)(n - k) means the probability of failure to the power of number of failures.
If there were many more, say we are looking for how many scenarios for 4 success in 100 trials, above method would be very tedious, and very error prone. Therefore, we usually use an alternative approach, namely the choose function which is useful for calculating the number of ways to choose k successes in n trials.
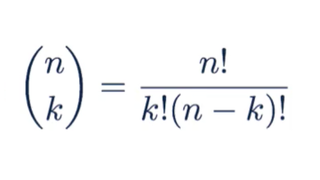
To evaluate this choose function, we divide n factorial by k factorial times n-k factorial.
Choose function - examples
How many scenarios yield 1 success in 4 trials
n = 4, k = 1
             4!          4 × 3 × 2 × 1
(4 1) = ------------- = ---------------- = 4
         1! × (4-1)!     1 × 3 × 2 × 1
In R, the associate function is also called choose and it takes two arguments n and k. So:
> choose(4,1)
[1] 4
How many scenarios yield 2 success in 9 trials
n = 9, k = 2
             9!          9 × 8 × 7!
(9 2) = ------------- = ------------- = 36
         2! × (9-2)!     2 × 1 × 7!
In R, the associate function is also called choose and it takes two arguments n and k. So:
> choose(9,2)
[1] 36
Definition of Binomial Distribution
Put all above together, if p represents probability of success, (1-p) represents probability of failure, n represents number of independent trials, and k represents number of success:
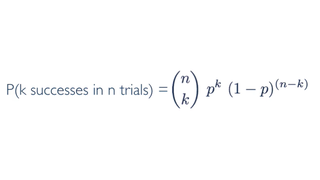
where:
Binomial Conditions
What does it take for a random variable to follow a binomial distribution? Here are the 4 conditions:
- The trials must be independent.
- The number of trials, n , must be fixed.
- Each trial outcome must be classified as a success or a failure.
- The probability of success, p, must be the same for each trial.
Examples 1
According to a 2013 Gallup poll, worldwide only 13% of employees are engaged at work (psychologically committed to their jobs and likely to be making positive contributions to their organizations). We are interested in finding the probability that among a random sample of 10 employees, what is the probability that 8 of them are engaged at work?
We can find this probability answer using the binomial distribution, because it actually meet the conditions required for the binomial distribution.
Solution 1 - Calculate by hand
n = 10
p = 0.13
1 - p = 0.87
k = 8

Therefore,
P(k = 8) = (10  8) × 0.138 × 0.872

      10!
= ----------  × 0.138 × 0.872
   8! × 2!

= 0.00000278
Solution 2 - Use R dbinom()
We can also calculate the same probability using R, dbinom() and takes 3 arguments. The 1st argument is the number of successes, the 2nd argument is sample size or the number of trials, and the 3rd argument is the probability of success.
> dbinom(8, size = 10, p = 0.13)
[1] 2.77842e-06
Solution 3 - Use web app
The app link is available from https://gallery.shinyapps.io/dist_calc/
References & Resources
- N/A
Latest Post
- Dependency injection
- Directives and Pipes
- Data binding
- HTTP Get vs. Post
- Node.js is everywhere
- MongoDB root user
- Combine JavaScript and CSS
- Inline Small JavaScript and CSS
- Minify JavaScript and CSS
- Defer Parsing of JavaScript
- Prefer Async Script Loading
- Components, Bootstrap and DOM
- What is HEAD in git?
- Show the changes in Git.
- What is AngularJS 2?
- Confidence Interval for a Population Mean
- Accuracy vs. Precision
- Sampling Distribution
- Working with the Normal Distribution
- Standardized score - Z score
- Percentile
- Evaluating the Normal Distribution
- What is Nodejs? Advantages and disadvantage?
- How do I debug Nodejs applications?
- Sync directory search using fs.readdirSync