Confidence Interval
Definition
A plausible range of values for the population parameter is called a confidence interval.
Using only a sample statistic to estimate a parameter is like fishing in a murky lake with a spear. And using confidence interval is like fishing with a net. We can throw a spear where we saw a fish, but we probably will miss. If we toss a net in that area, though, we have a good chance of catching the fish. In other words,

- If we report a point estimate, we probably won't hit the exact population parameter.
- On the other hand, if we report a range of plausible values we have a good shot at capturing the parameter.
So, based on this one sample's mean, how can we figure out what this range of plausible values is going to be?
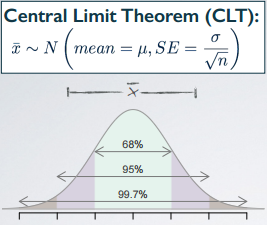
Well, this one sample mean, x̄, is indeed our best guess for the unknown population mean. Therefore, any interval we construct should be constructed around that x̄ that we know to be our best guess. Also from the central limit theorem, we know that x̄ are distributed nearly normally, and the center of that distribution is at the unknown population mean.
One more piece of item that we want to think about is the 68, 95, and 99.7% rule, which tells us that roughly 95% of random samples will have sample means that are within 2 standard errors of the population mean. Clearly then, for 95% of random samples, the unknown true population mean is going to be within 2 standard errors of that sample's mean.
Note: the 95% here only applies to random samples.
Once we actually have a sample, the mean of that sample will be either within 2 standard errors of the population mean or it won't be. So the 95% confidence interval can be constructed approximately as our sample mean + or - 2 standard errors.
95% CI ≈ x̄ ± 2SE

CI stands for confidence interval
SE stands for standard error
In above formula, the 2 standard errors, is actually called the margin of error (ME).
So usually we construct a confidence interval as a point estimate. In this case we are dealing with mean, so our point estimate is the sample mean, ± some margin of error. The margin of error for a 95% confidence interval is roughly 2 standard error.
A Practice Problem
One of the earliest examples of behavioral asymmetry is a preference in humans for turning the head to the right, rather than to the left, during the final weeks of gestation and for the first 6 months after birth. This is thought to influence subsequent development of perceptual and motor preferences.
A study of 124 couples found that 64.5% turned their heads to the right when kissing. The standard error associated with this estimate is roughly 4%. Which of the below is false?
- (a) A higher sample size would yield a lower standard error;
- (b) The margin of error for a 95% CI for the percentage of kissers who turn their heads to the right is roughly 8%;
- (c) The 95% CI for the percentage of kissers who turn their heads to the right is roughly 64.5% ± 4%;
- (d) The 99.7% CI for the percentage of kissers who turn their heads to the right is roughly 64.5% ± 12%;
The (a) says a higher sample size would yield a lower standard error. This is always true because we have seen this with the central limit theorem as well. Conceptually this is because the higher sample sizes, the less variable your point estimates from those samples are going to be.
For (b), we know that the margin of error for a 95% confidence interval is going to be approximately 2 × standard error. So in this case the standard error is given to 4% and therefore (b) is correct.
The confidence interval is always the form, point estimate ± a margin of error. In (c), what we have is our point estimate, the sample proportion, ± a standard error, as opposed to the margin of error. And while those things sound similar, they're not exactly the same thing. Therefore, (c) is wrong. The approximate 95% confidence interval should be 64.5% ± 8%.
According to the 68, 95, and 99.7% rule, the 99.7% of the distribution will be within 3 standard deviations of the mean. In (d), it is 3 standard errors, since we're looking for the variability of a point estimate. So, 3 × 4 give us 12%. So (d) is also correct.
References & Resources
- N/A
Latest Post
- Dependency injection
- Directives and Pipes
- Data binding
- HTTP Get vs. Post
- Node.js is everywhere
- MongoDB root user
- Combine JavaScript and CSS
- Inline Small JavaScript and CSS
- Minify JavaScript and CSS
- Defer Parsing of JavaScript
- Prefer Async Script Loading
- Components, Bootstrap and DOM
- What is HEAD in git?
- Show the changes in Git.
- What is AngularJS 2?
- Confidence Interval for a Population Mean
- Accuracy vs. Precision
- Sampling Distribution
- Working with the Normal Distribution
- Standardized score - Z score
- Percentile
- Evaluating the Normal Distribution
- What is Nodejs? Advantages and disadvantage?
- How do I debug Nodejs applications?
- Sync directory search using fs.readdirSync