Data Basic
Introduction
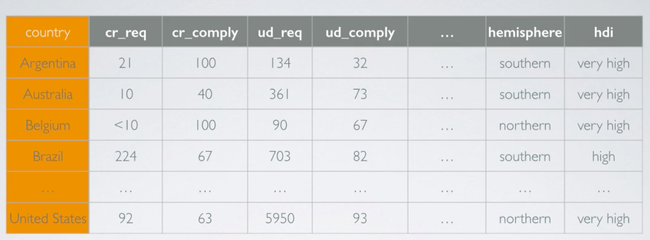
Data are organised as data matrix as shown below:
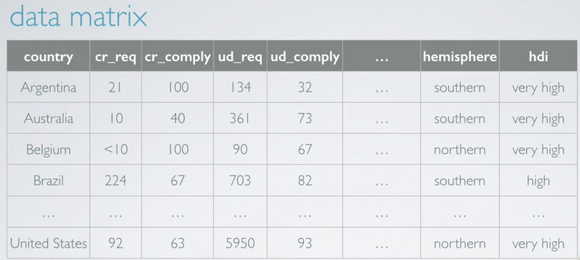
Each row represents an observation or a case and each column represents a variable .
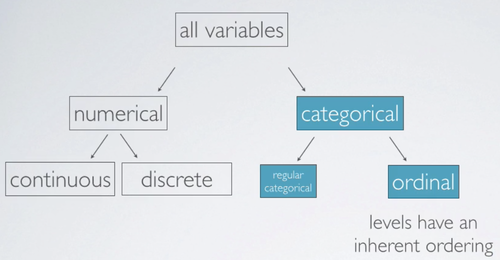
There are two types of variable: Numerical and Categorical.
- Numerical (Quantitative) variables take on numerical values, it is sensible to add, substract, take averages, etc. with these values.
- Categorical (Qualitative) variables take on a limited number of distinct categories. Categories can be identified with numbers, but it wouldn't be sensible to do arithmetic operations with these values. They are merely placeholders for the levels of categorical variable.
Numerical variables can be further categorized as Continuous or Discrete:
- Continuous numerical variable are usually measured, and can take on any numerical value. Such as height, weight. While we tend to round our height or weight when we record it, it is actually measured on a continuous scale.
- Discrete numerical variables are generally counted, such as number of cars a house, cars a household owns, and can take on only whole non-negative numbers.
It is important to think about the nature of the variable, and not just the observed values when determining if a numerical variable is continuous or discrete, as rounding of continuous variables can make them appear to be discrete.
Categorical variable can be also further categorized as follows:
- Categorical variable that have ordered levels are called ordinal. For example: very unsatisfied, unsatisfied, neutral, satisfied, or very satisfied.
- If the levels do not have an inherent ordering to them, then the variable is simply called categorical. For example: male or female.
Thus, the following data can be classifed as follows:
- cr_req: Number of content removal requests made to Google -> discrete numerical;
- cr_comply: Percentage of content removal requests Google complied with -> continuous numerical;
- ud_req: Number of user data requests as part of a criminal investigation -> discrete numerical;
- ud_comply: Percentage of user data requests Google complied with -> continuous numerical;
- hemisphere: Hemisphere that the country is located in -> categorical;
- hdi: Human development index -> ordinal categorical;
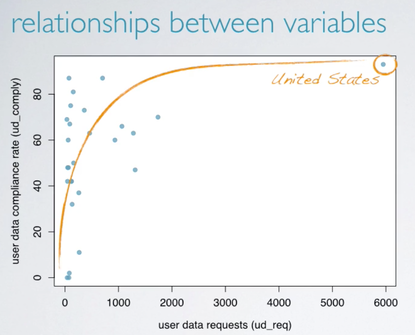
Relationships between variables
- When two variables show some connection with one another, they are called associated, or dependent, variables;
- The association can be further described as positive or negative;
- If two variables are not associated, they are said to be independent.
For example, the association of the following two variable appears to be positive.
References & Resources
- N/A
Latest Post
- Dependency injection
- Directives and Pipes
- Data binding
- HTTP Get vs. Post
- Node.js is everywhere
- MongoDB root user
- Combine JavaScript and CSS
- Inline Small JavaScript and CSS
- Minify JavaScript and CSS
- Defer Parsing of JavaScript
- Prefer Async Script Loading
- Components, Bootstrap and DOM
- What is HEAD in git?
- Show the changes in Git.
- What is AngularJS 2?
- Confidence Interval for a Population Mean
- Accuracy vs. Precision
- Sampling Distribution
- Working with the Normal Distribution
- Standardized score - Z score
- Percentile
- Evaluating the Normal Distribution
- What is Nodejs? Advantages and disadvantage?
- How do I debug Nodejs applications?
- Sync directory search using fs.readdirSync