Measure of Center
Center
-
Mean: Arithmetic average;
- Sample mean is denoted as x bar
 ;
; - Population mean is denoted as Mu
 ;
;
- Sample mean is denoted as x bar
- Median: Midpoint of the distribution (50th percentile);
- Mode: Most frequent observation;
Sample statistics are point estimates of the population parameters. These estimates may not be perfect, but if the sample is good (representative of the population) they are usually good guesses.
Example 1: Odd number of observation

- Mean: (75 + 69 +88 + 93 + 95 + 54 + 87 + 88 + 64)/9 = 75.11
- Mode: 88 (The most frequent observed value, in this case it is 88)
- Median: 87 (To do this, firstly sort the data in increasing order, then we find the mid-point of the ordered data)
Example 2: Even number of observation
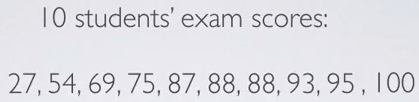
In this case, we have 87 and 88 at the middle of our distribution.
- Median: (87 + 88)/2 = 87.5
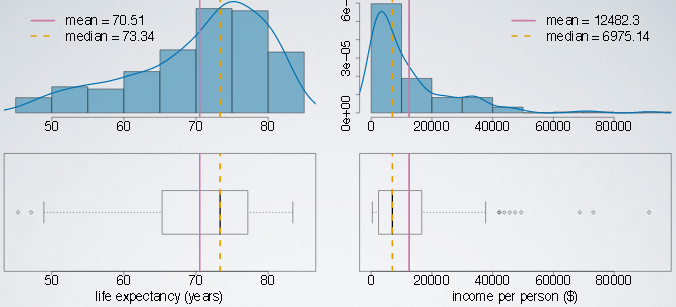
Skewness vs. Measures of Center
- In left skewed distributions, the lower valued observations pull the mean to themselves, and therefore the mean is generally lower than the median.
- In a symmetric distribution, the mean and the median are roughly equal to each other in the center of the distribution.
- In right skewed distributions, the high valued observations pull the mean, the arithmetic average to themselves, and therefore the mean is generally larger than the median.
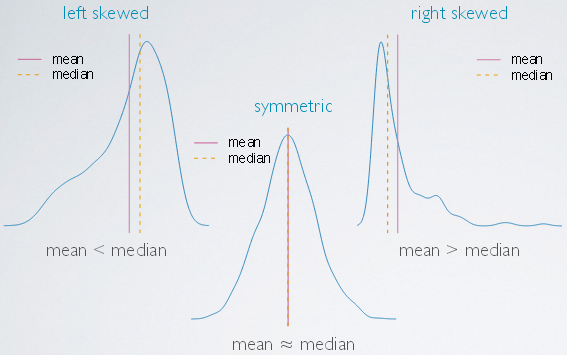
An example is shown below:
References & Resources
- N/A
Latest Post
- Dependency injection
- Directives and Pipes
- Data binding
- HTTP Get vs. Post
- Node.js is everywhere
- MongoDB root user
- Combine JavaScript and CSS
- Inline Small JavaScript and CSS
- Minify JavaScript and CSS
- Defer Parsing of JavaScript
- Prefer Async Script Loading
- Components, Bootstrap and DOM
- What is HEAD in git?
- Show the changes in Git.
- What is AngularJS 2?
- Confidence Interval for a Population Mean
- Accuracy vs. Precision
- Sampling Distribution
- Working with the Normal Distribution
- Standardized score - Z score
- Percentile
- Evaluating the Normal Distribution
- What is Nodejs? Advantages and disadvantage?
- How do I debug Nodejs applications?
- Sync directory search using fs.readdirSync