Normal Distribution
Introduction
Many variable in nature are nearly normally distributed. A commonly used example is height.
Normal Distribution
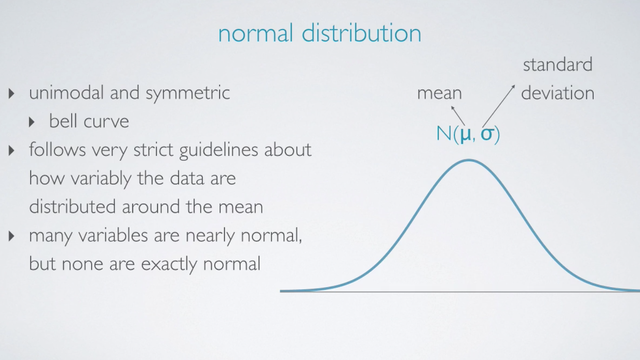
The Normal Distribution is Unimodal and Symmetric. It is also referred to as the Bell curve due to the distribution resembling a bell shape. However, it is not just any symmetric unimodal curve. It follow very strict guidelines about how variably the data are distributed around the mean.
While many variables are merely normal, but none are exactly normal due to the following strict guidelines:
The Normal Distribution has two parameters.
- The mean that denoted as μ
- The standard deviation that denoted as σ
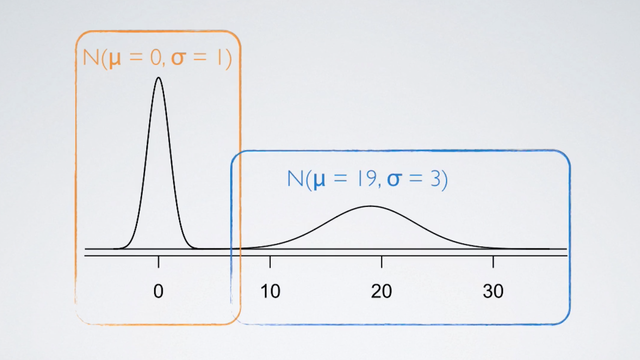
Shape of the distribution - μ and σ
Here we see two normal distribution, one centered at 0 with a standard deviation 1, the other centered at 19 with a standard deviation of 3. There are a good representation of how changing the center and the spread of the distribution actually changes the overall shape of the distribution.
68-95-99.7% rule
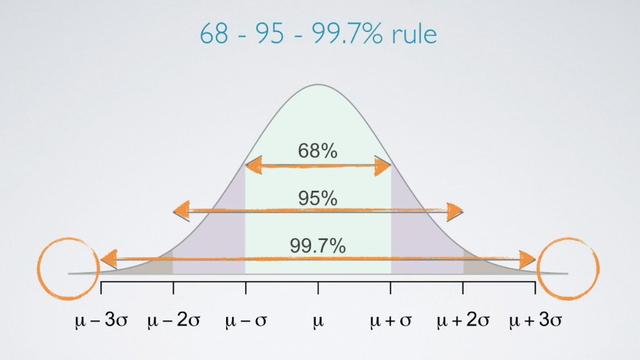
So, what are the strict rules that govern the variability of normally distributed data around the mean of the distribution?
For nearly normally distributed data,
- 68% falls within one standard deviation of the mean.
- 95% falls within two standard deviation of the mean.
- 99.7% falls within three standard deviation of the mean.
- It is possible for observations to fall > three standard of the mean, but these occurrences are very rare.
Examples
Use 68-95-99.7% rule to estimate the standard deviationWe can use the 68-95-99.7% rule to estimate the standard deviation of a normal model, given just a few parameters about the distribution of the data.
A doctor collects a large set of heart rate measurements that approximately follow a normal distribution. He only reports 3 statistics, the mean = 110 beats per minute, the minimum = 65 beats per minute, and the maximum = 155 beats per minute. Which of the following is most likely to be the standard deviation of the distribution?
- 5
- 15
- 35
- 90
We are going to make use of the fact that in a normal distribution, almost all of the data lie within three standard deviations of the mean. So the expected minimum and maximum for above are:
- 5 → 110 ± (3 ∗ 5) = (95, 125)
- 15 → 110 ± (3 ∗ 15) = (65, 155) Best Choice
- 35 → 110 ± (3 ∗ 35) = (5, 215)
- 90 → 110 ± (3 ∗ 90) = (-160, 380)
References & Resources
- N/A
Latest Post
- Dependency injection
- Directives and Pipes
- Data binding
- HTTP Get vs. Post
- Node.js is everywhere
- MongoDB root user
- Combine JavaScript and CSS
- Inline Small JavaScript and CSS
- Minify JavaScript and CSS
- Defer Parsing of JavaScript
- Prefer Async Script Loading
- Components, Bootstrap and DOM
- What is HEAD in git?
- Show the changes in Git.
- What is AngularJS 2?
- Confidence Interval for a Population Mean
- Accuracy vs. Precision
- Sampling Distribution
- Working with the Normal Distribution
- Standardized score - Z score
- Percentile
- Evaluating the Normal Distribution
- What is Nodejs? Advantages and disadvantage?
- How do I debug Nodejs applications?
- Sync directory search using fs.readdirSync