Observational studies and experiments, sampling and source bias
Observational study & Experiment
The observational study is defined as follows:
- Collect data in a way that does not directly interfere with how the data arise, i.e. merely "observe";
- Based on an observational study, we can only establish an association, in ohter words correlation, between the explanatory and response variables;
- If an observational study uses data from the past, it is called retrospective study, whereas if data are collected throughout the study, it is called prospective;
The experiment study is defined as follows:
- Randomly assign subjects to various treatments;
- Can establish causal connections between the explanatory and response variables;
An Example
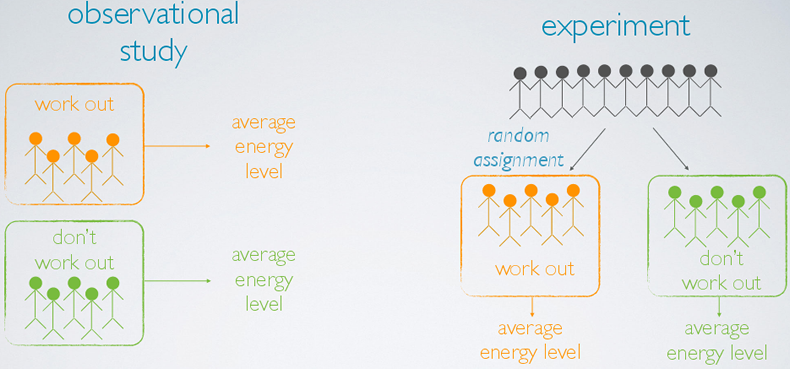
Suppose we want to evaluate the relationship between regularly working out and energy level. We can design the study as an observational study or an experiment.
- In an observational study, we sample two types of people from the population, those who choose to work out regularly and those who don't. Then, we find the average energy level for the two groups of people and compare.
- In an experiment, we sample a group of people from the population, and we randomly assign these people into two groups: those who will regularly work out throughout the course of study, and those who will not. The difference is that the decision of whether to work out or not is not left up to the subjects as in the observational study, but is instead imposed by researcher. At the end, we compare the energy level of the two groups.
Based on the observational study, even if we find a difference between the energy levels of these two groups of people, we really can't attribute this difference solely to working out because there may be other variables that we didn't control for in this study that contribute to the observed difference. For example, people who are in better shape might be more likely to regularly work out and also have higher energy levels. However, in the experiment such variables that might also contribute to the outcome are likely equally represented in the two groups due to random assignment. Therefore, if we find a difference between the two averages, we can indeed make a causal statement attributing this difference to working out.
Important Conclusions
- Confounding variables: Extraneous variables that affect both the explanatory and the response variable, and that make it seem like there is a relationship between them are called confounding variables.
- Correlation does not imply causation. What determines whether we can infer causation or correlation depends on the type of study that we're basing our decisions on. Observational studies, for the most part, only allow us to make correlational statements, while experiments allow us to infer causation. We said for the most part because there are actually more advanced methods, broadly titled causal inference, that allow for making causal inferences from observational studies.
- The main difference between observational studies and experiments is that most experiments use random assignment while observational studies do not.
Census Vs Sample
Previously, we mentioned taking a sample from the population, but one might ask, wouldn't it be better to just include everyone and sample the entire population, in other words, conduct a census?
However, belows are the problems of Census:
- Conducting a census takes lots of resources.
- Some individuals are hard to locate or measure, and these people be different from the result of the population.
- For example: in the U.S. census illegal immigrants are often not recorded properly. Since they tend to be reluctant to fill out census forms with the concern that this information could be shared with immigration. However, these individuals might possess characteristics different than the rest of the population. And hence not getting information from them might result in very unreliable data from geographical regions with high concentrations of illegal immigrants.
- Populations rarely stand still.
- Even if you could take a census, the population changes constantly. So it's never really possible to get a perfect measure.
Sampling Bias
- Convenience sample bias: individuals who are easily accessible are more likely to be included in the sample.
For example, say you want to find out how people in your city feel about a recent increase in public transportation costs. If you only poll people in your neighborhood, as opposed to a representative sample from the whole city Your study will suffer from convenience sample bias. - Non-response bias: If only a (non-random) fraction of the randomly sampled people respond to a survey such that the sample is no longer representative of the population. This happens if only a non-random fraction of the randomly sampled people respond to a survey, such that the sample is no longer representative of the population.
For example, say, you take a random sample of individuals from your city and attempt to survey them. But certain segments of the population, say those from a lower socioeconomic status, are less likely to respond to the survey. - Voluntary response bias: Occurs when the sample consists of people who volunteer to respond because they have strong opinions on the issue.
For example, say you place polling machines at all bus stops and metro stations in your city. But only those who choose to do so actually take the time to vote and express their opinion on the recent increase in public transportation costs.
Sampling
Some sampling methods are listed as follows, namely:
- Simple Random Sampling
- Stratified Sampling
- Cluster Sampling
Random Sampling
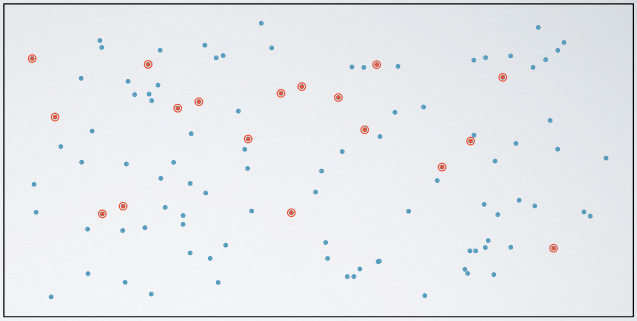
In simple random sampling, we randomly select cases from the population such that each case is equally likely to be selected. This is similar to randomly drawing names from a hat.
Stratefied Sampling
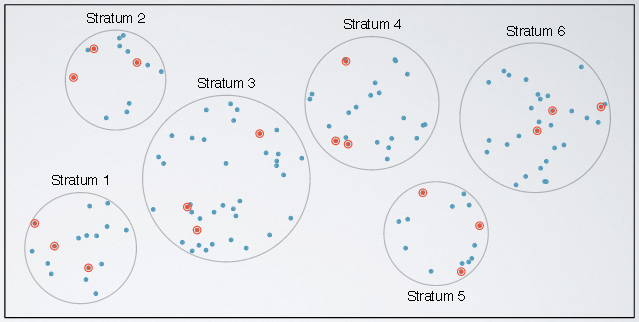
In stratefied sampling, we first divide the population into homogenous groups called strata. And then randomly sample from within each stratum. For example, if we wanted to make sure both genders are equally represented in a study, we might divide the population first into males and females, and then randomly sample from within each group.
Cluster Sampling
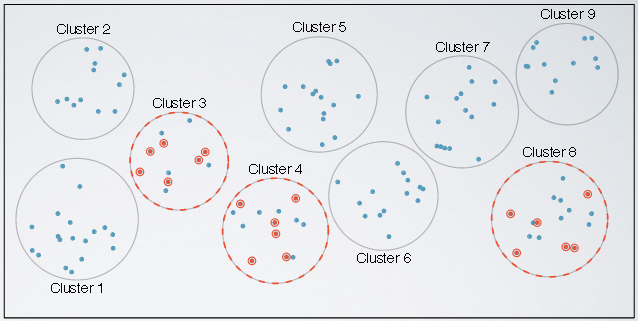
In cluster sampling, we divide the population into clusters, randomly sample a few clusters, and then randomly sample from within these clusters. This looks similar to stratified sampling, but the difference is that the groups, called clusters, are not necessarily homogeneous within themselves. But each cluster is similar to another, such that we can get away with sampling from just a few of the clusters. Usually, we do this for economical reasons. For example, one might divide the city into geographic regions that are, on average, similar to each other. And then sample randomly from a few randomly picked regions in order to avoid traveling to all regions.
References & Resources
- N/A
Latest Post
- Dependency injection
- Directives and Pipes
- Data binding
- HTTP Get vs. Post
- Node.js is everywhere
- MongoDB root user
- Combine JavaScript and CSS
- Inline Small JavaScript and CSS
- Minify JavaScript and CSS
- Defer Parsing of JavaScript
- Prefer Async Script Loading
- Components, Bootstrap and DOM
- What is HEAD in git?
- Show the changes in Git.
- What is AngularJS 2?
- Confidence Interval for a Population Mean
- Accuracy vs. Precision
- Sampling Distribution
- Working with the Normal Distribution
- Standardized score - Z score
- Percentile
- Evaluating the Normal Distribution
- What is Nodejs? Advantages and disadvantage?
- How do I debug Nodejs applications?
- Sync directory search using fs.readdirSync