Correlation
Introduction
The correlation is one of the most common and most useful statistics. A correlation is a single number that describes the degree of relationship between two variables. Let’s work through an example to show how this statistics is computed.
Correlation Example
Let’s assume that we want to look at the relationship between two variables, height and self esteem. Perhaps we have a hypothesis that how tall you affect your self esteem. Let’s say we collect some data from 20 individuals. Height is measured in inches. Self esteem is measured based on the average of 10 1-to-5 rating items, where higher scores mean higher self esteem. Below is the data:
| Person | Height | Self Esteem |
|---|---|---|
| 1 | 68 | 4.1 |
| 2 | 71 | 4.6 |
| 3 | 62 | 3.8 |
| 4 | 75 | 4.4 |
| 5 | 58 | 3.2 |
| 6 | 60 | 3.1 |
| 7 | 67 | 3.8 |
| 8 | 68 | 4.1 |
| 9 | 71 | 4.3 |
| 10 | 69 | 3.7 |
| 11 | 68 | 3.5 |
| 12 | 67 | 3.2 |
| 13 | 63 | 3.7 |
| 14 | 62 | 3.3 |
| 15 | 60 | 3.4 |
| 16 | 63 | 4.0 |
| 17 | 65 | 4.1 |
| 18 | 67 | 3.8 |
| 19 | 63 | 3.4 |
| 20 | 61 | 3.6 |
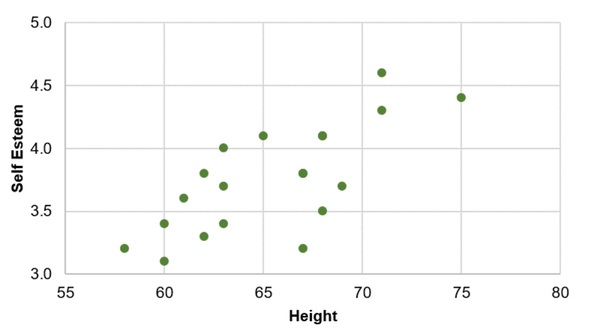
Now, let’s take a quick look at the histogram for each variable:
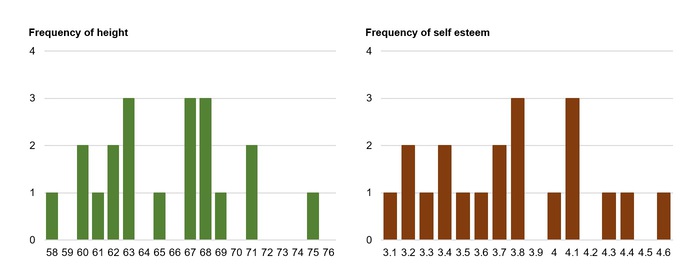
And, here are the descriptive statistics:
| Variable | Mean | StDev | Variance | Sum | Minimum | Maximum | Range |
|---|---|---|---|---|---|---|---|
| Height | 65.4 | 4.40574 | 19.4105 | 1308 | 58 | 75 | 17 |
| Self Esteem | 3.755 | 0.426090 | 0.181553 | 75.1 | 3.1 | 4.6 | 1.5 |
Calculating the Correlation
Now we are ready to compute the correlation value. The formula for the correlation is:
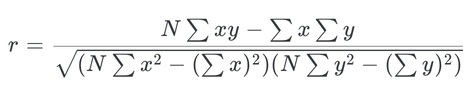
Where N is the number of the pair, ∑xy is the sum of the products of the pair, ∑x is the sum of x, ∑y is the sum of y, ∑x2 is the sum of the squared x, ∑y2 is the sum of the squared y.
For above case, N=20, ∑xy=4937.6, ∑x=1308, ∑y=75.1, ∑x2 =85912, ∑y2=285.45. Now, when we plug these values into the formula given above, we get the following:
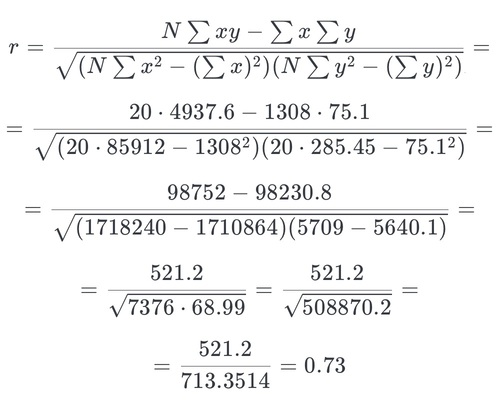
The correlation for this case is 0.73, which is a fairly strong positive relationship. So, we guess there is a relationship between height and self esteem, at least in this made up data!
References & Resources
- N/A
Latest Post
- Dependency injection
- Directives and Pipes
- Data binding
- HTTP Get vs. Post
- Node.js is everywhere
- MongoDB root user
- Combine JavaScript and CSS
- Inline Small JavaScript and CSS
- Minify JavaScript and CSS
- Defer Parsing of JavaScript
- Prefer Async Script Loading
- Components, Bootstrap and DOM
- What is HEAD in git?
- Show the changes in Git.
- What is AngularJS 2?
- Confidence Interval for a Population Mean
- Accuracy vs. Precision
- Sampling Distribution
- Working with the Normal Distribution
- Standardized score - Z score
- Percentile
- Evaluating the Normal Distribution
- What is Nodejs? Advantages and disadvantage?
- How do I debug Nodejs applications?
- Sync directory search using fs.readdirSync