Normal Probability Plot
What is Normal Probability Plot
The normal probability plot is a graphical technique for assessing whether or not a data set is approximately normally distributed.
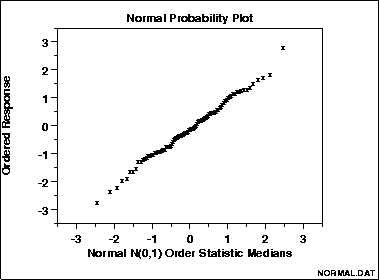
The data are plotted against a theoretical normal distribution in such a way that the points should form an approximate straight line. Departures from this straight line indicate departures from normality.
Sample Plot

The points on this plot form a nearly linear pattern, which indicates that the normal distribution is a good model for this data set.
How to form Normal Probability Plot
The normal probability plot is formed by:
- Vertical axis: ordered response values;
- Horizontal axis: normal order statistic medians;
The observations are plotted as a function of the corresponding normal order statistic medians which are defined as:
Ni = G(Ui)where Ui are the uniform order statistic medians (defined below) and G is the percent point function of normal distribution.
Percent Point Function
The percent point function is the inverse of the cumulative distribution function (probability that x is less than or equal to some value). That is, given a probability, we want the corresponding x of the cumulative distribution function.
Uniform Order Statistic Medians
The uniform order statistic medians can be approximated by:
Ui = 1 - Un    for i = 1
Ui = (i - 0.3175)/(n + 0.365)    for i = 2, 3, ..., n-1
Ui = 0.5(1/n)    for i = n
In addition, a straight line can be fit to the points and added as a reference line. The further the points vary from this line, the greater the indicatioin of departures from normality.
What Normal Probability Plot can answer?
The normal probability plot is used to answer the following questions:
- Are the data normally distributed?
- What is the nature of the departure from normality (data skewed, shorter than expected tails, longer than expected tails)?
Examples
References & Resources
- N/A
Latest Post
- Dependency injection
- Directives and Pipes
- Data binding
- HTTP Get vs. Post
- Node.js is everywhere
- MongoDB root user
- Combine JavaScript and CSS
- Inline Small JavaScript and CSS
- Minify JavaScript and CSS
- Defer Parsing of JavaScript
- Prefer Async Script Loading
- Components, Bootstrap and DOM
- What is HEAD in git?
- Show the changes in Git.
- What is AngularJS 2?
- Confidence Interval for a Population Mean
- Accuracy vs. Precision
- Sampling Distribution
- Working with the Normal Distribution
- Standardized score - Z score
- Percentile
- Evaluating the Normal Distribution
- What is Nodejs? Advantages and disadvantage?
- How do I debug Nodejs applications?
- Sync directory search using fs.readdirSync