Confidence Interval for a Population Mean
For a Population Mean
More formally, the confidence interval for a population mean can be computed as:
CIpopulation mean = sample mean ± a margin of error.
              =


The z* is critical value, which corresponding to the middle XX% of the normal distribution × the standard error of the sampling distribution.
Conditions for above Confidence Interval
Some conditions that need to be satisfied to use this formula to construct confidence intervals. In fact, since this method is based on the central limit theorem, these are actually the same conditions.
There are
- Independence;
- Sample size/skew;
Independence
The sampled observations must be independent. And this is very difficult to verify, but it is more likely, if we have used random sampling or assignment, depending on whether we have an observational study, where we're sampling from the population, randomly, or we have an experiment where we're randomly assigning experimental units to various treatments.
And if sampling without replacement, n < 10% of the population
Sample size/skew
The other condition is related to the sample size or skew. We either need n to be ≥ 30 or larger if the population distribution is very skewed. This 2nd condition is actually a little stricter than central limit theorem . Because it places a minimum required sample size requirement, n ≥ 30.
Finding the critical value 95% confidence
The formula for the confidence interval for the mean as:
And we said that the z* for a 95% confidence interval should be approximately 2 × SD, as per the 68, 95, and 99.7% rule. But this rule is simply a ruleof thumb, and it's actually not exact. So here is how we find the exact critical value for a 95% confidence interval.
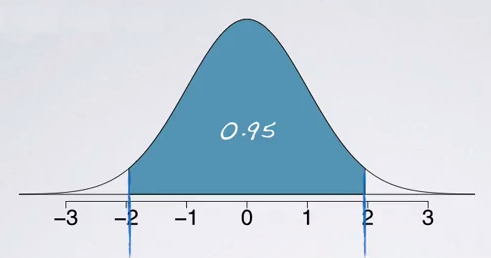
The confidence level refers to the middle of the distribution. So the 95% confidence interval will span the middle 95% of the normal distribution. So, it can be marked on the normal curve like:
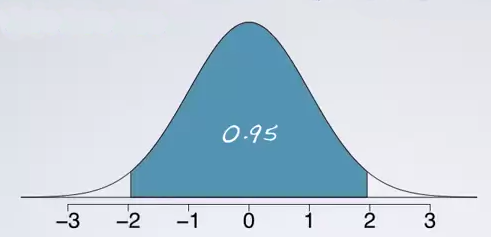
And we bascially looking for the cut off value that mark the middle 95%.
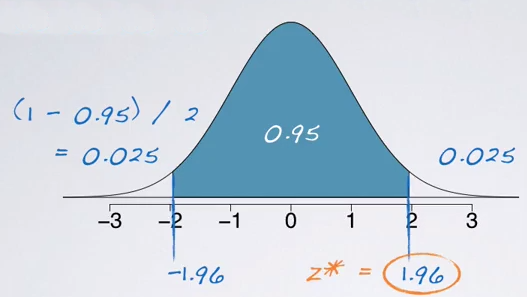
We can use the normal probability table to find these cut off value, but first remember that the tables always give us areas under the curve below a given z scores, so the areaunder the curve below the lower bound of the middle 95% is:
(1 - 0.95)/2 = 0.025
So, we want to do is to locate 0.025 for each of sides. So, look at the edges of the table to grab the associated z score.
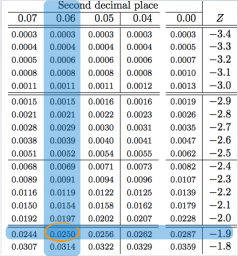
So, here comes out to be -1.96 for lower bound and the upper bound will then be 1.96 since the curve is symmetric. The critical values in a confidence interval formula are always defined to be positive. Therefore, the exact critical value for a 95% confidence interval is actually 1.96.
Get z* using R
Also, we can get the z* value using R.
> qnorm(0.025)
[1] -1.96
References & Resources
- N/A
Latest Post
- Dependency injection
- Directives and Pipes
- Data binding
- HTTP Get vs. Post
- Node.js is everywhere
- MongoDB root user
- Combine JavaScript and CSS
- Inline Small JavaScript and CSS
- Minify JavaScript and CSS
- Defer Parsing of JavaScript
- Prefer Async Script Loading
- Components, Bootstrap and DOM
- What is HEAD in git?
- Show the changes in Git.
- What is AngularJS 2?
- Confidence Interval for a Population Mean
- Accuracy vs. Precision
- Sampling Distribution
- Working with the Normal Distribution
- Standardized score - Z score
- Percentile
- Evaluating the Normal Distribution
- What is Nodejs? Advantages and disadvantage?
- How do I debug Nodejs applications?
- Sync directory search using fs.readdirSync