Binomial Distribution Standard Deviation
Question from an Example
Among a random sample of 100 employees, how many would you expect to be engaged at work?
Worldwide only 13% of employees are engaged at work, so p = 0.13
The expected number of engaged employees is:
n × p = 100 × 0.13 = 13
More formally, the Expected Value (mean) of binomial distribution is:
Expected Value (mean) of binomial distribution = μ = np
However, this doesn't mean that in every random sample of 100 employees exactly 13 will be engaged at work. In some examples, this value will be fewer, and in others, more. So how much would we expect this value to vary?
Standard Deviation of Binomial Distribution
As usual, we can quantify the variability around the mean using the standard deviation. And for Binomial Distribution, the standard deviation is defined as the square root of np(1-p):
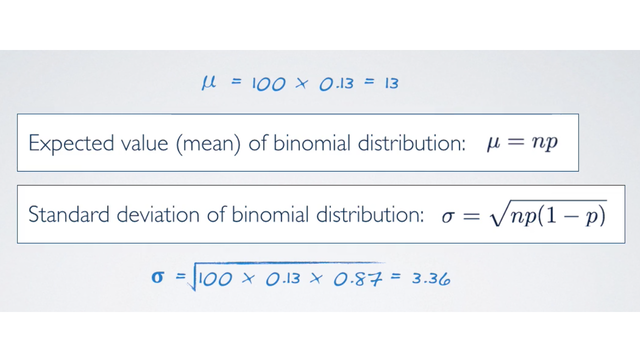
So, plug in the values from the survey, we would expect:
sqrt(100 × 0.13 × 0.87) = 3.36.
This means that 13 out of 100 employees are expected to be at engaged at work, give or take approximately 3.36.
References & Resources
- N/A
Latest Post
- Dependency injection
- Directives and Pipes
- Data binding
- HTTP Get vs. Post
- Node.js is everywhere
- MongoDB root user
- Combine JavaScript and CSS
- Inline Small JavaScript and CSS
- Minify JavaScript and CSS
- Defer Parsing of JavaScript
- Prefer Async Script Loading
- Components, Bootstrap and DOM
- What is HEAD in git?
- Show the changes in Git.
- What is AngularJS 2?
- Confidence Interval for a Population Mean
- Accuracy vs. Precision
- Sampling Distribution
- Working with the Normal Distribution
- Standardized score - Z score
- Percentile
- Evaluating the Normal Distribution
- What is Nodejs? Advantages and disadvantage?
- How do I debug Nodejs applications?
- Sync directory search using fs.readdirSync