Evaluating the Normal Distribution
Introduction
Let us talk a little bit about how to evaluate whether a distribution is nearly normal or not.
Here is a histogram, a normal probability plot of a sample of 100 male heights.

For the normal probability plot :
- On a normal probability plot, data are plotted on the y-axis. The theoretical quantiles follow a normal distribution on the x-axis.
- If there is a one-to-one relationship between the data and the theoretical quantiles, then the data follow a nearly normal distribution.
- Since a one-to-one relationship would appear as straight line on a scatter plot, the closer the points are to a perfect straight line, the most confident we can be that the data follow the normal model.
- Constructing a normal probability plot requires calculating percentiles and corresponding z-scores for each observation, which is tedious. Therefore we generally rely on software when making these plots.
Example of data that do NOT really follow a normal distribution.
How it appears on the histogram? How it appears on a normal probability plot?
These are height of NBA players from the 2008 and 2009 season.
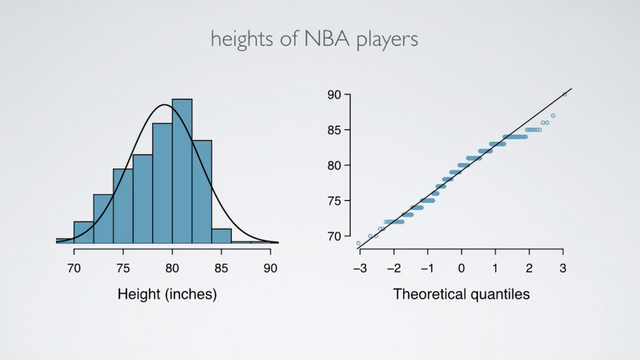
Since NBA players tend to be disproportionately taller compared to the general population, the distribution of their heights is left-skewed. On a normal probability plot, left skew appears as points bending down and to the right of the normal line.
We also see that these points in theoretical quantiles plots have jumps, and that's actually due to rounding when reporting heights.
Normal Probability Plot
Just like histogram, normal probability plot also reveal shapes of distributions.
| Plot | |
|---|---|
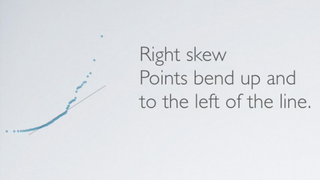 |
In the right skew distribution, points bend up and to the left of the line. |
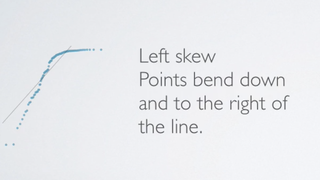 |
In the left skew distribution, points bend down and to the right of the line. |
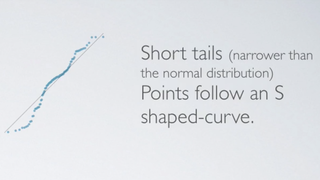 |
In the short tails (narrower than the normal distribution) distribution, points follow an S shaped-curve. |
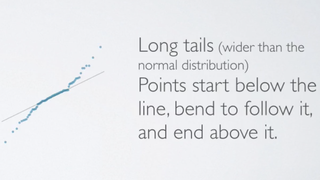 |
In the long tials (wider than the normal distribution) distribution, points start below the line, bend to follow it, and end above it. |
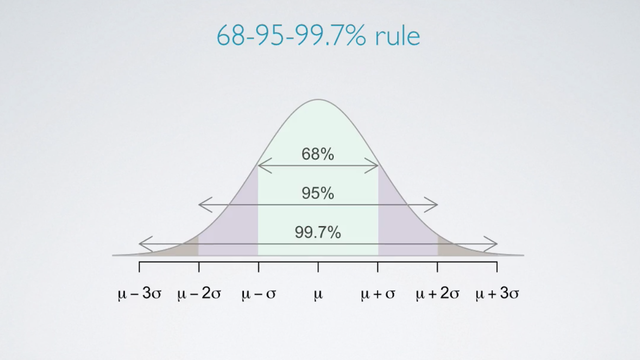
In addition, you cal also use the 68-95-99.7% rule to evaluate normality by assessing whether the distribution follows what's required by this rule.
References & Resources
- N/A
Latest Post
- Dependency injection
- Directives and Pipes
- Data binding
- HTTP Get vs. Post
- Node.js is everywhere
- MongoDB root user
- Combine JavaScript and CSS
- Inline Small JavaScript and CSS
- Minify JavaScript and CSS
- Defer Parsing of JavaScript
- Prefer Async Script Loading
- Components, Bootstrap and DOM
- What is HEAD in git?
- Show the changes in Git.
- What is AngularJS 2?
- Confidence Interval for a Population Mean
- Accuracy vs. Precision
- Sampling Distribution
- Working with the Normal Distribution
- Standardized score - Z score
- Percentile
- Evaluating the Normal Distribution
- What is Nodejs? Advantages and disadvantage?
- How do I debug Nodejs applications?
- Sync directory search using fs.readdirSync